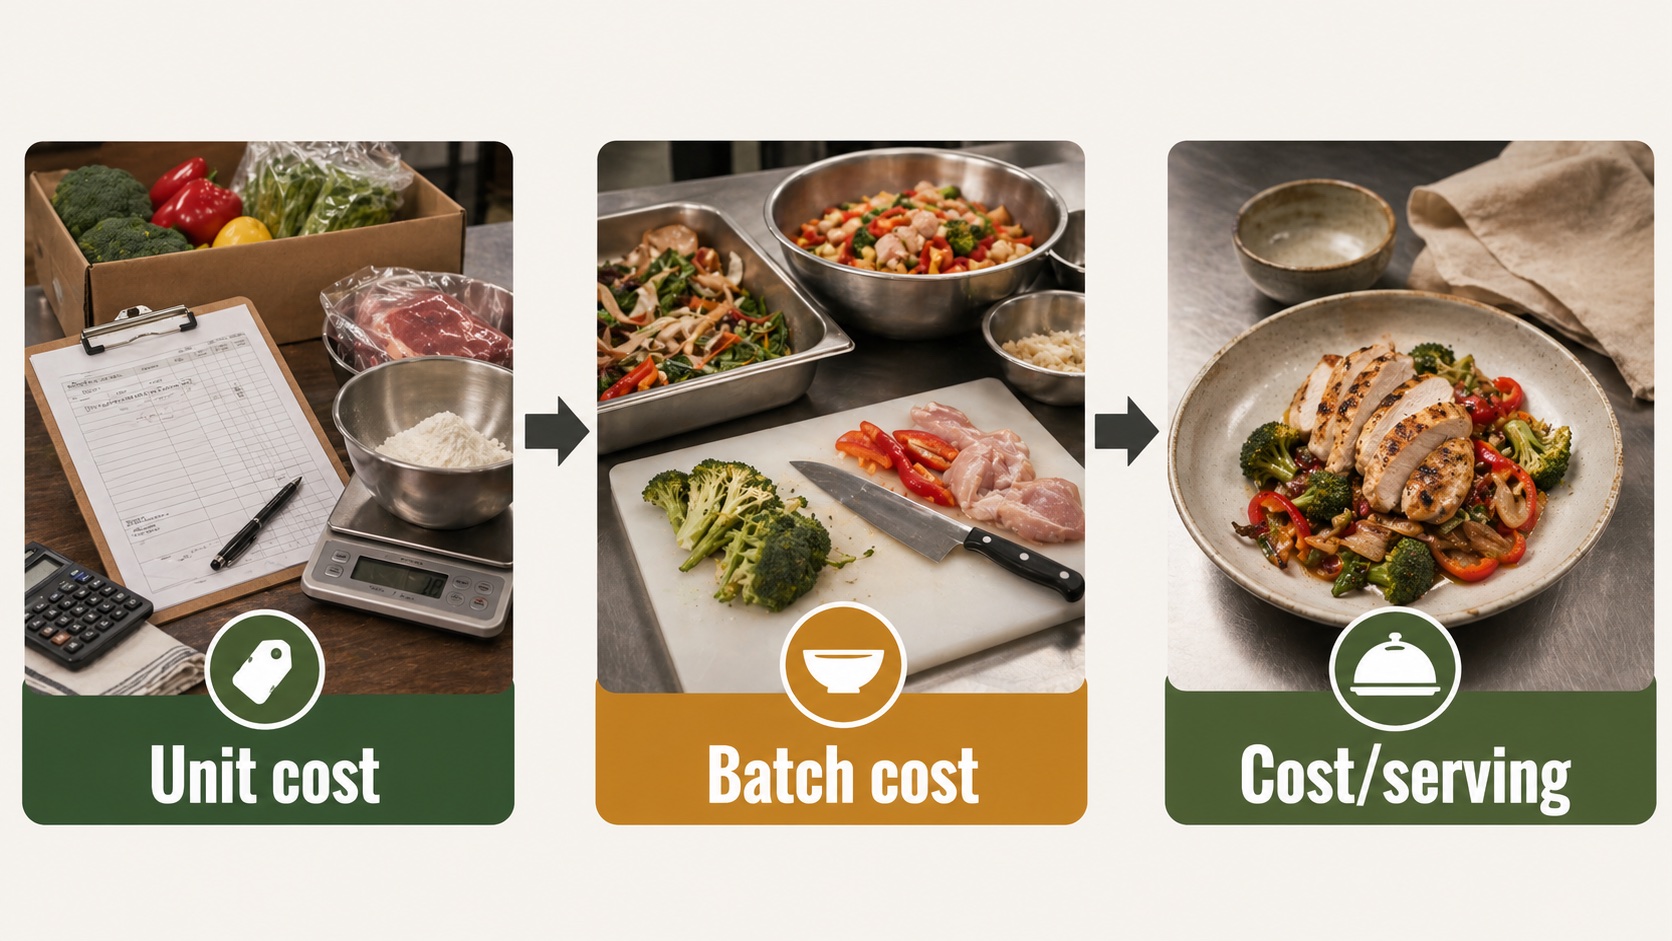
Recipe costing turns supplier prices, yield loss, and recipe amounts into a cost per serving. The core workflow is: unit cost × amount used = ingredient cost, then total recipe cost ÷ servings = cost per serving.
Use this guide when you need the formula-first workflow: ingredient cost, batch cost, cost per serving, food cost percentage, and menu price.
Quick Path
- If you searched
recipe costing, stay on this page for the full formula and pricing workflow. - If you cost flour, butter, sugar, eggs, or bakery batches, read the Baking Ingredient Cost Calculator.
- If you sell baked goods, compare the Cookie Shop Cost Guide and Cupcake Bakery Cost Guide.
- If labor is the next constraint after ingredients, use the US Restaurant Labor Cost Calculator.
If you want to try the workflow before reading the full formula, use the free restaurant recipe-cost spreadsheet and setup guide.
The worked prices and yields below are hypothetical. Replace them with supplier invoices and prep measurements. A recipe cost covers the ingredients included in the calculation; it does not establish the profit after labor, rent or other costs.
What Is Recipe Costing?
Recipe costing is the process of calculating the ingredient cost to produce one batch (or one serving) of a dish. It answers the fundamental question: “How much does it actually cost me to make this?”
Once you know your recipe cost, you can:
- Set menu prices that hit your target food cost percentage
- Compare the amount each item leaves to cover labor and overhead
- React quickly when ingredient prices change
- Compare supplier quotes with real impact on your bottom line
The 5 Core Formulas
Every recipe cost calculation follows these five steps:
1. Usable Amount (after trim/waste)
Usable Amount = Purchase Weight × (1 − Loss Rate)For example, a 10 lb case with an assumed 15% trim loss gives 8.5 lbs of usable meat. That loss rate is an input, not a standard for chicken. Keep the recipe quantity on the same prepared-weight basis.
2. Unit Cost
Unit Cost = Purchase Price ÷ Usable AmountIf that case costs $28.00: Unit Cost = $28.00 ÷ 8.5 lbs = $3.29/lb
3. Ingredient Cost (per recipe)
Ingredient Cost = Unit Cost × Amount Used in RecipeIf your recipe calls for 1.5 lbs: $3.29 × 1.5 = $4.94
4. Total Recipe Cost
Total Recipe Cost = Sum of all Ingredient CostsAdd up every ingredient in the recipe; including oil, seasoning, and garnish.
5. Cost Per Serving
Cost Per Serving = Total Recipe Cost ÷ Yield (number of servings)If the recipe makes 6 portions: Total Cost ÷ 6 = cost per plate.
Step-by-Step Example: Chicken Alfredo
Let’s cost out a batch of chicken alfredo that yields 6 servings.
Ingredient Costs
| Ingredient | Purchase Size | Price | Loss Rate | Usable | Recipe Amount | Cost |
|---|---|---|---|---|---|---|
| Chicken breast | 3 lbs | $9.87 | 10% | 2.7 lbs | 2 lbs | $7.31 |
| Fettuccine | 1 lb | $1.79 | 0% | 1 lb | 1 lb | $1.79 |
| Heavy cream | 1 pint (16 fl oz) | $4.29 | 0% | 16 fl oz | 12 fl oz | $3.22 |
| Parmesan | 8 oz | $5.49 | 5% | 7.6 oz | 4 oz | $2.89 |
| Butter | 1 lb (16 oz) | $5.29 | 0% | 16 oz | 3 oz | $0.99 |
| Garlic | 1 head (~1.5 oz) | $0.50 | 15% | 1.275 oz | 0.5 oz | $0.20 |
| Olive oil | 16.9 fl oz | $6.99 | 0% | 16.9 fl oz | 1 fl oz | $0.41 |
| Salt & pepper | n/a | n/a | n/a | n/a | allowance | $0.10 |
| Total | $16.91 |
Use weight ounces for the solid ingredients and fluid ounces for the cream and oil. Do not treat weight and volume as interchangeable. Costs below use the rounded row amounts; other rounding conventions can differ by a cent.
Cost Per Serving
$16.91 ÷ 6 servings = $2.82 per plateWhat This Means for Pricing
| Menu price assumption | Food cost % | Amount left after $2.82 of ingredients |
|---|---|---|
| $8.99 | 31.4% | $6.17 |
| $11.99 | 23.5% | $9.17 |
| $6.99 | 40.3% | $4.17 |
The amount left still has to cover labor, rent, utilities, transaction fees and other costs. None of these prices is profitable just because the ingredient percentage falls within a particular range.
Food Cost Percentage: What to Target
Food cost percentage tells you what share of your menu price goes to ingredients:
Food Cost % = Ingredient Cost ÷ Menu Price × 100Compare targets using the same recipe cost
At an illustrative cost of $2.82 per serving, different chosen targets produce different prices:
| Chosen food cost target | Calculation | Calculated price, rounded to cents |
|---|---|---|
| 25% | $2.82 ÷ 0.25 | $11.28 |
| 30% | $2.82 ÷ 0.30 | $9.40 |
| 35% | $2.82 ÷ 0.35 | $8.06 |
These targets are assumptions, not recommendations for a restaurant type. Choose a price you can sell at, estimate the quantity sold, and check whether the amount left covers the remaining costs and your required profit.
The Pricing Formula
Once you know your cost per serving, use this formula to set your menu price:
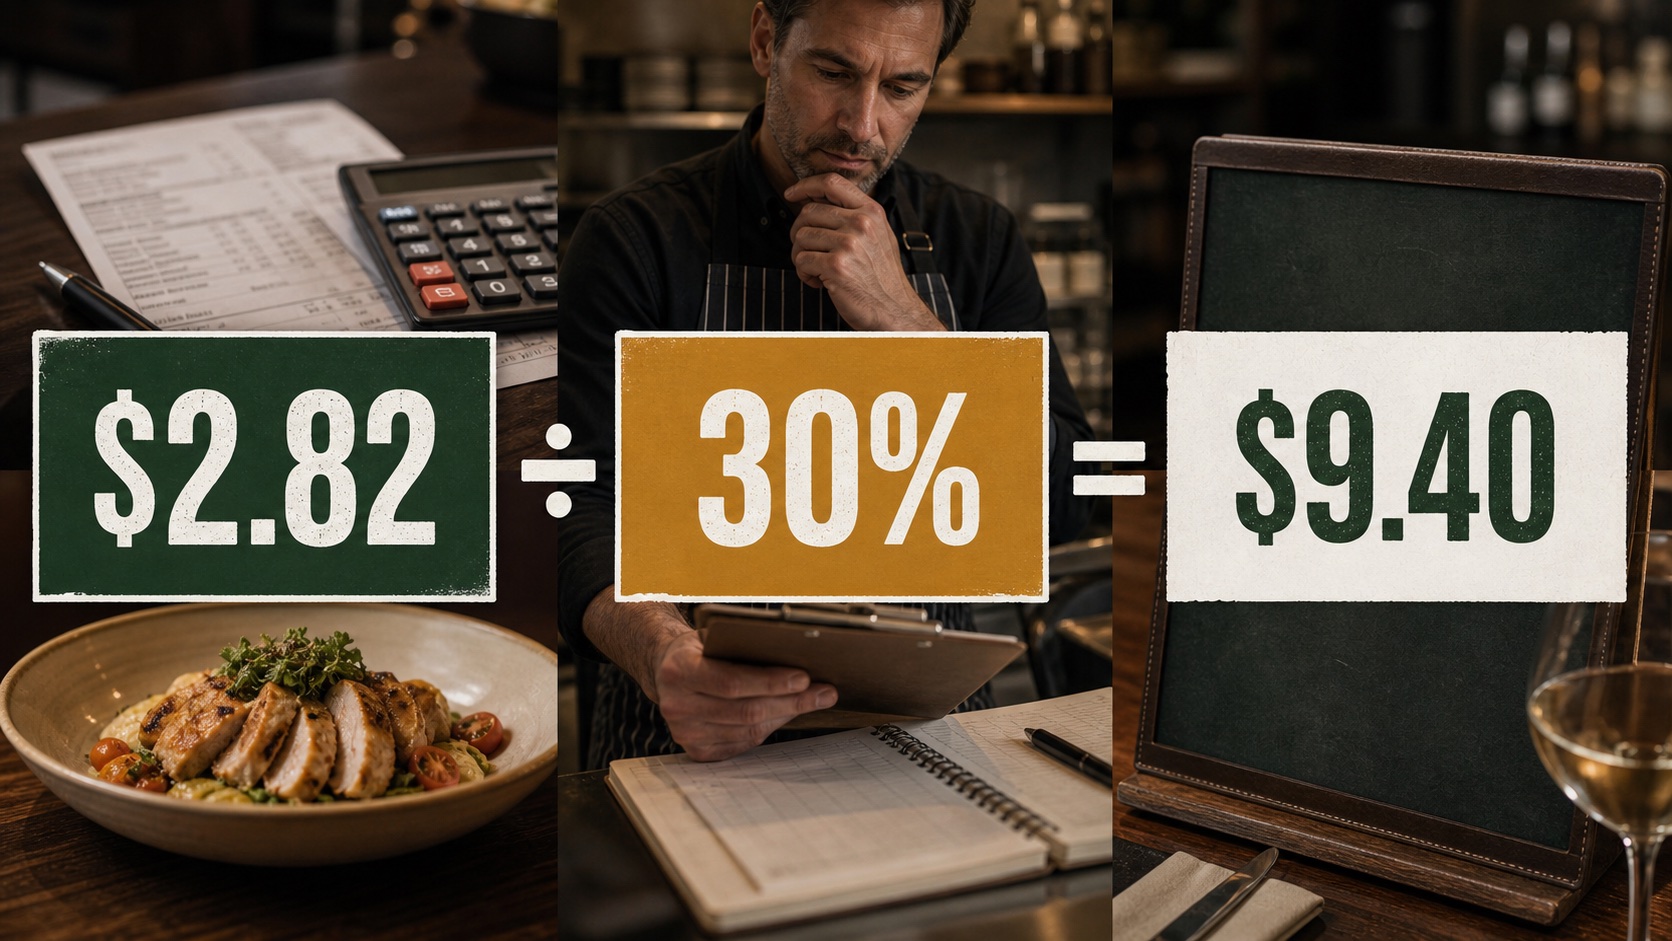
Menu Price = Cost Per Serving ÷ Target Food Cost %Example: $2.82 cost ÷ 0.30 (30% target) = $9.40 menu price
Or use the margin-based formula:
Menu Price = Cost Per Serving ÷ (1 − Target Margin)$2.82 ÷ (1 − 0.70) = $2.82 ÷ 0.30 = $9.40
Food cost percentage and gross margin are related but different concepts. A 30% food cost leaves 70% gross margin before labor and overhead, but it does not mean the business keeps 70% profit.
Why Loss Rate Matters
If a recipe uses trimmed ingredients but the unit cost is based on the untrimmed purchase weight, it understates that ingredient’s cost.
For a hypothetical tenderloin purchase at $32.99/lb with measured trim loss of 35%, one purchased pound yields 0.65 usable pounds. The usable unit cost is $32.99 ÷ 0.65 = $50.75/lb, rounded. That is about 54% above the purchased-weight unit cost. It is not a market price or a standard trim rate.
Here is the same relationship with a hypothetical 1,000 g purchase costing $10:
| Assumed loss | Usable amount | Cost per 1,000 g of usable ingredient |
|---|---|---|
| 0% | 1,000 g | $10.00 |
| 10% | 900 g | $11.11 |
| 35% | 650 g | $15.38 |
Weigh a prep batch before and after the relevant preparation step. Record the cut, product specification and process with the measurement. If a recipe quantity is cooked weight, use a matching cooked yield; if it is trimmed raw weight, use that basis. Do not apply a loss again if it is already included in the usable unit cost.
The USDA Food Buying Guide distinguishes food as purchased (AP) from its edible portion (EP). Its tables serve child nutrition program planning; they are not restaurant food-cost targets. Use the distinction to keep quantity and price on the same basis.
Common Recipe Costing Mistakes
1. Forgetting “cheap” ingredients
Include oil, salt, spices and garnish in the batch. If a small quantity is difficult to weigh per plate, measure a batch or document an allowance and check it against actual prep use.
2. Using package price instead of unit cost
“A bag of flour costs $4” means nothing until you know how much of that bag goes into one recipe.
3. Not updating costs when prices change
If your recipe cost sheet still says “$0.25 per egg” when the real price is $0.40, every dish using eggs is undercosted. The same problem happens with dairy, flour, fryer oil, proteins, and packaging.
4. Ignoring yield variations
Does your recipe make 6 servings or 5.5? That half-serving gap changes your per-plate cost by 9%.
5. Calculating once and never again
Recipe costing isn’t a one-time event. Review costs monthly; or immediately when you get a price increase from your supplier.
Spreadsheets vs. Dedicated Apps
A spreadsheet can keep a shared ingredient-price table and reference it from multiple recipes. An app can provide another way to maintain those records. Compare the actual workflow before choosing either:
| Task | What to check |
|---|---|
| Supplier price changes | Which recipes reference the same ingredient record? |
| Prep recipes such as sauces | Is the batch yield correct, and is its portion cost carried forward? |
| Trim loss | Is it applied once, on the same basis as the recipe amount? |
| Pricing | Can you compare a price you choose with the current recipe cost? |
| Monthly review | Can you trace each number to an invoice or prep measurement? |
Shared records still need correct units, quantities and updates. Neither format resolves those choices automatically.
Getting Started
If you have 5 minutes
Pick your top-selling menu item. Look up the current prices for each ingredient. Run the math from this guide. Compare the result with the cost you last used for pricing.
If you have 30 minutes
Cost out your top 5 menu items. Calculate the food cost percentage for each. Rank the amount left after ingredients, then check the other costs needed to serve each item.
For a full menu review
Enter all your ingredients into a recipe costing tool (spreadsheet or app), include loss rates, and calculate costs for your full menu. Then set target margins and adjust pricing.
Related Guides
- Baking Ingredient Cost Calculator: Flour, butter, sugar, eggs, and batch yield math
- US Cookie Shop Cost Guide: Portion size, mix-ins, and box pricing
- US Cupcake Bakery Cost Guide: Singles, dozen boxes, and custom topping costs
- US Dumpling Shop Cost Guide: Filling, wrapper, and batch prep economics
- US Restaurant Labor Cost Calculator: What to check after ingredient cost
- US Restaurant Utility Cost Guide: Energy and overhead costs that sit outside food cost
- Delivery App Profit Guide: Delivery channel margin after platform costs
Checks before using a recipe cost
- Use matching units and preparation stages for unit cost and recipe quantity.
- Include every ingredient, then divide batch cost by the measured portion yield.
- Apply trim or cooking loss once, using your own measured yield.
- Compare both the ingredient percentage and the dollar amount left at your chosen price.
- Update invoice prices and include labor, overhead and channel costs before judging profit.
KitchenCost can help maintain ingredient and recipe costs and compare them with selling prices you choose. Downloading the app is free; paid options are available through in-app purchases.
Method Notes
This guide uses durable recipe-costing formulas and sample numbers for illustration. Replace sample prices, yields, and target food cost percentages with your own supplier invoices, prep tests, and sales mix.
- Unit cost: purchase price ÷ usable amount
- Ingredient cost: unit cost × recipe amount
- Total recipe cost: sum of all ingredient costs
- Cost per serving: total recipe cost ÷ servings
- Menu price: cost per serving ÷ target food cost percentage